Your Data
Meet your Taste Graph
A living, breathing map of what you love to eat and drink.
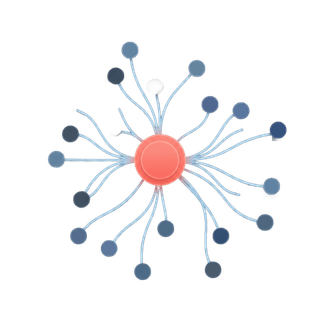
Interactive Graph Visualization
It connects the dots
You liked the spicy tuna roll.
You also rated a citrusy cocktail highly.
Traditional apps see two isolated ratings.
Bonapi sees a pattern: You enjoy bright, acidic flavors with a kick.
"We use this connection to recommend a Peruvian ceviche place next—something you might never have found otherwise."
The Logic
- NODE User (You)
- LINKED BY
- EDGE Felt: "Loved it" + "Adventurous"
- TO ITEM
- NODE Menu Item (Spicy Tuna)
How it learns
1. Eye
You scan a menu. We extract every item, ingredient, and price using LLMs.
2. Brain
Our algorithms map these items to thousands of latent taste dimensions.
3. Heart
You rate your experience. Not just a number, but how it felt.
4. Growth
Your Graph expands. The system gets smarter about YOU.
Why it's better
| FEATURE | GOOGLE MAPS / YELP | BONAPI |
|---|---|---|
| Recommendation Basis | Popularity (crowd average) | Personal Taste Alignment |
| Menu Data | User photos (unstructured) | Digitized & Semantic |
| Cross-Category | None | Yes (Coffee taste predicts Wine taste) |
| Privacy | Ad-targeting | Private Taste Graph |